Debugging
Open a console and type Juno.@enter split("Hello, world", isspace). You should see something like the following (without the red annotations):
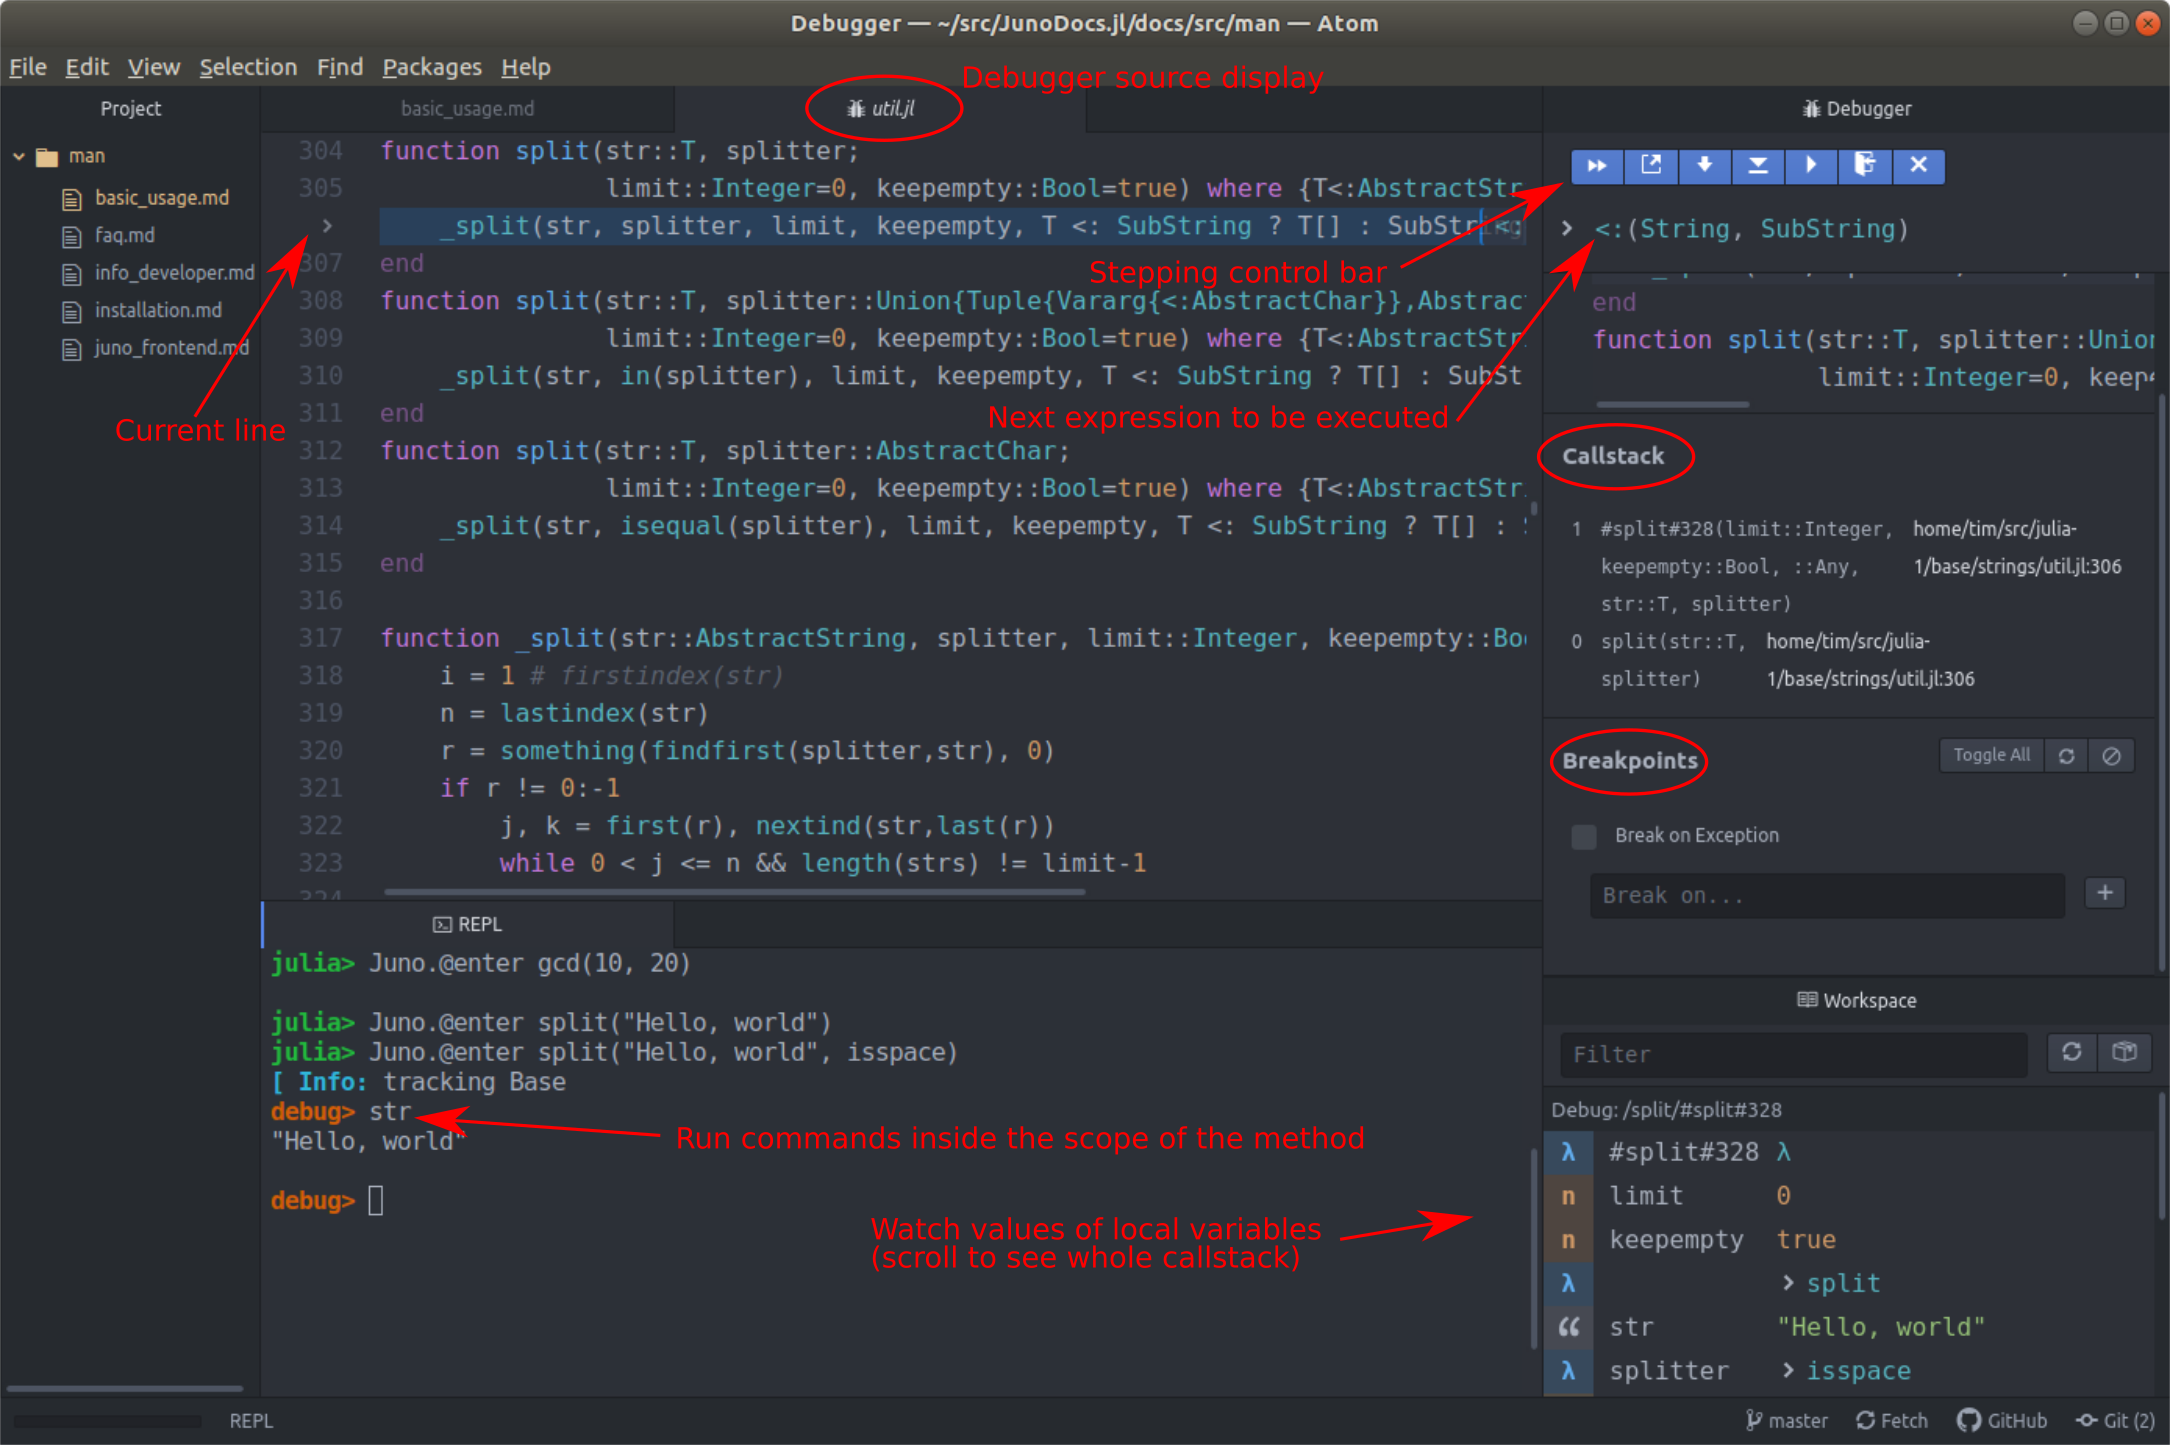
(Your arrangement of panes may be different, but if you wish you can adjust these to match.) Some of the key features of this display are annotated in red. We're going to walk through some of these item-by-item.
The first thing to note is that a window has opened to util.jl, with a little "bug icon" next to it. This is a view of the source code that defines the split function you've entered into. Execution is paused at the first line, a call to _split.
Now turn your attention to the upper right. There are two key elements there, a control bar and a display of the next statement to be executed. Try hovering over the buttons on the control bar to get a sense for what they do (we'll use some of them in a minute).
Notice that the "next expression" display does not show _split; instead, it's <:(String, SubString), which originates from a portion of that first line, in the source written as T <: SubString. (T is a type parameter, the type of str which here is String.) This is an indication that before calling _split, we have to do a bit of preliminary work.
In the control bar, find the button for "Next Expression" and click it. While the line in the source code display (the pane with util.jl) doesn't change its location, you can see an update in the next expression to be executed, now apply_type(SubString, String), meaning it will be executing the SubString{T}.
Continue to press "Next Expression" until the call to _split is queued up. Then press the button just to the right, "Step into Function". Now you'll see a change in the source window, a jump to a new execution point within _split.
Now let's turn our attention to a few other elements. The "Callstack" pane to the right should show a chain of calls; the first one (the one we entered) is at the bottom, and the current one is at the top. In this particular case you'll note a strange entry, something along the lines of #split#328 (the specific number may be different for you). This is revealing some of the internals of how Julia handles functions that have keyword arguments. To keep things from getting too tedious, the debugger stepped over some of the preparatory steps needed to construct the appropriate keyword arguments, but you can see the evidence in the callstack.
Below the Callstack pane is a very important pane, "Breakpoints." Breakpoints allow you to skip over many lines without stepping, and then stop at a particular line. You can set breakpoints in the console using the commands implemented by JuliaInterpreter, but perhaps easier is to click in the leftmost column. You'll see this location gets added to the list (previously empty) of breakpoints on the right hand side.
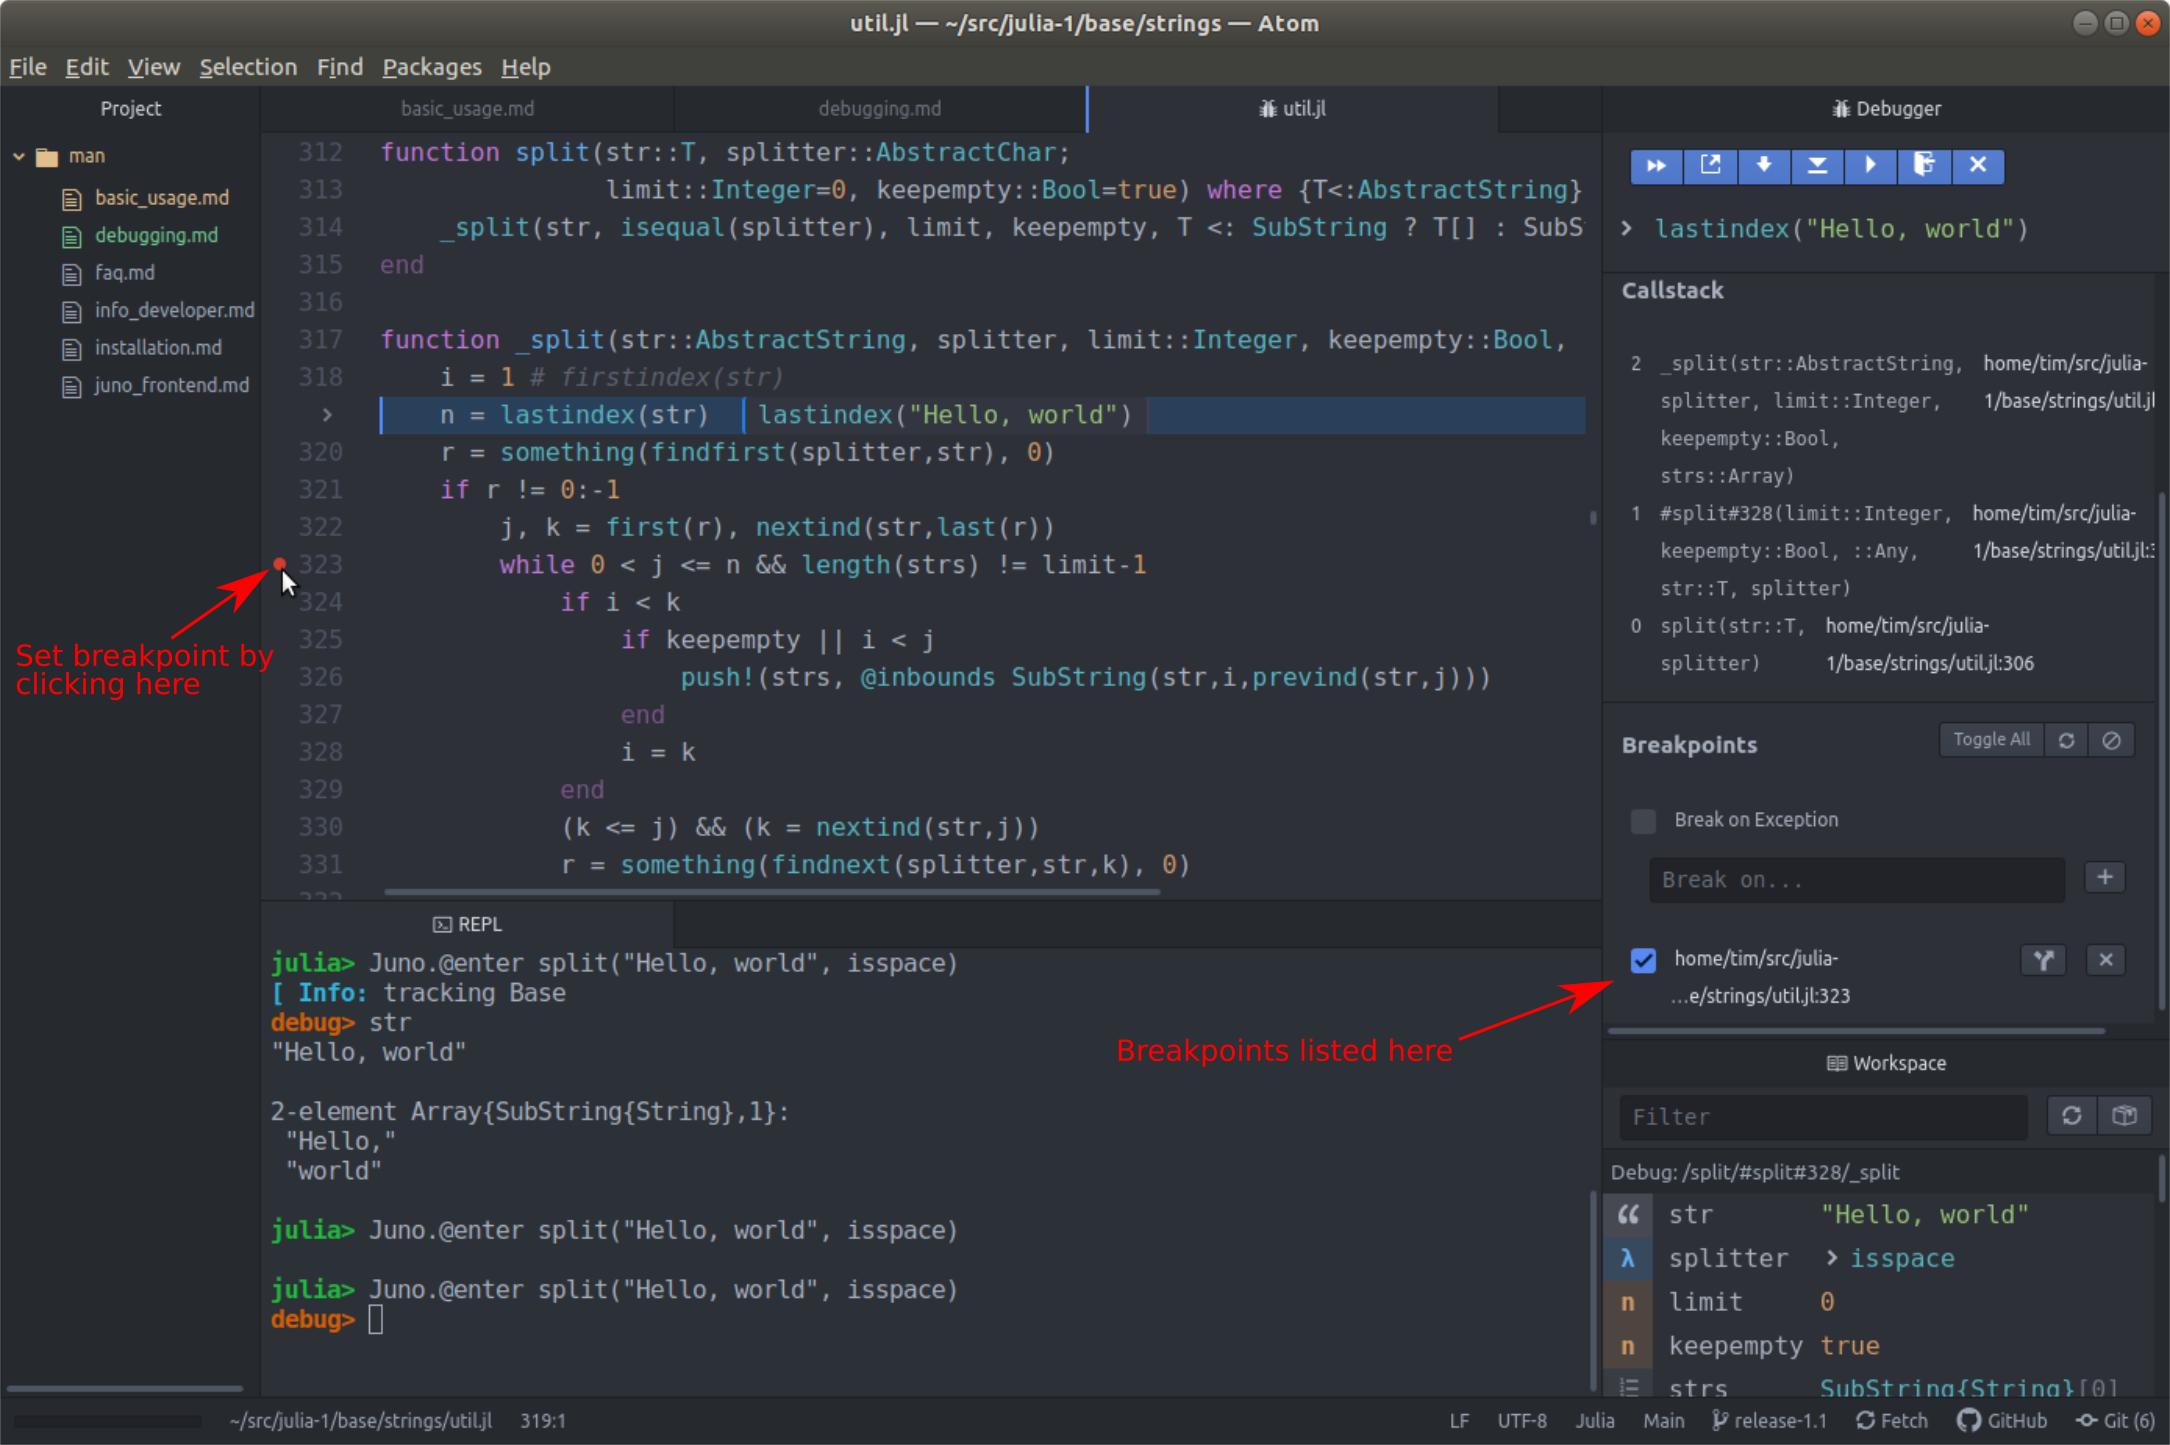
Up in the Debugger control bar, click the double-arrows indicating "Continue." You should see the execution jumps to the position of the breakpoint; the values of variables in the Workspace plane also update to reflect the new state.
In the Breakpoint panel, here are some fun things to try:
uncheck the box next to this breakpoint location; you should see the red dot to the left of the source line dim. This is an indication that you've
disabled this breakpoint; it hasn't been forgotten, but you've made it inactive (the fact that it hasn't been forgotten can be especially useful in conjunction with conditional breakpoints, discussed next). Click the box again to reactivate it.click the icon that looks like a fork in the road ("Edit Condition"). A dialog should open asking you to insert a breakpoint condition. The workspace indicates that
jhas a value of 7; type inj > 8and click "Confirm." Note that the icon next to that source line has turned blue, indicating a conditional breakpoint. Given the condition onjyou entered and the fact that the input string does not have any spaces at positions higher than 7, this breakpoint would not have been hit.To try out your new conditional breakpoint, first exit debugging by clicking the "x" in the Debugger control bar. Your console should return to the normal
julia>prompt; now, enterJuno.@run split("Hello there, world", isspace), where@runis like@enterfollowed by clicking "Continue". You'll return to the breakpoint, but nowj==13and the first substring, "Hello," has already been entered intostrs. This demonstrates that you already completed the first iteration of thiswhileloop before the condition was satisfied.Exit debugging again and click the "Clear Breakpoints" Check the "Break on Exception". Then enter an expression that would normally trigger an error:
Juno.@enter convert(UInt, -8). (You can't convert a negative number to aUInt.) Click "Continue." You should advance to a method,throw_inexacterror. Examine the Callstack pane to see the chain of calls that got you here.
This isn't an exhaustive overview of debugging in Juno, but hopefully it's enough to help you get started exploring on your own.